
Doing your due diligence and researching the individual funds you are contemplating investing in can honestly be a slog. But reading fund fact sheets are a necessary takes if you’re serious about your investments.
What Is a Fund Fact Sheet?
A fund fact sheet is a document that sums up a mutual fund or ETF. It tells you what the fund invests in, how risky it is, what it has earned in the past, and how much it costs each year. For mutual funds, this document is often called Fund Facts. For ETFs, you will see ETF Facts. For an official reference the Ontario Securities Commission’s education site has a clear breakdown of how Fund Facts work. You usually get the fact sheet as a PDF from your bank or advisor, or you can download it from the fund company’s website before you invest.
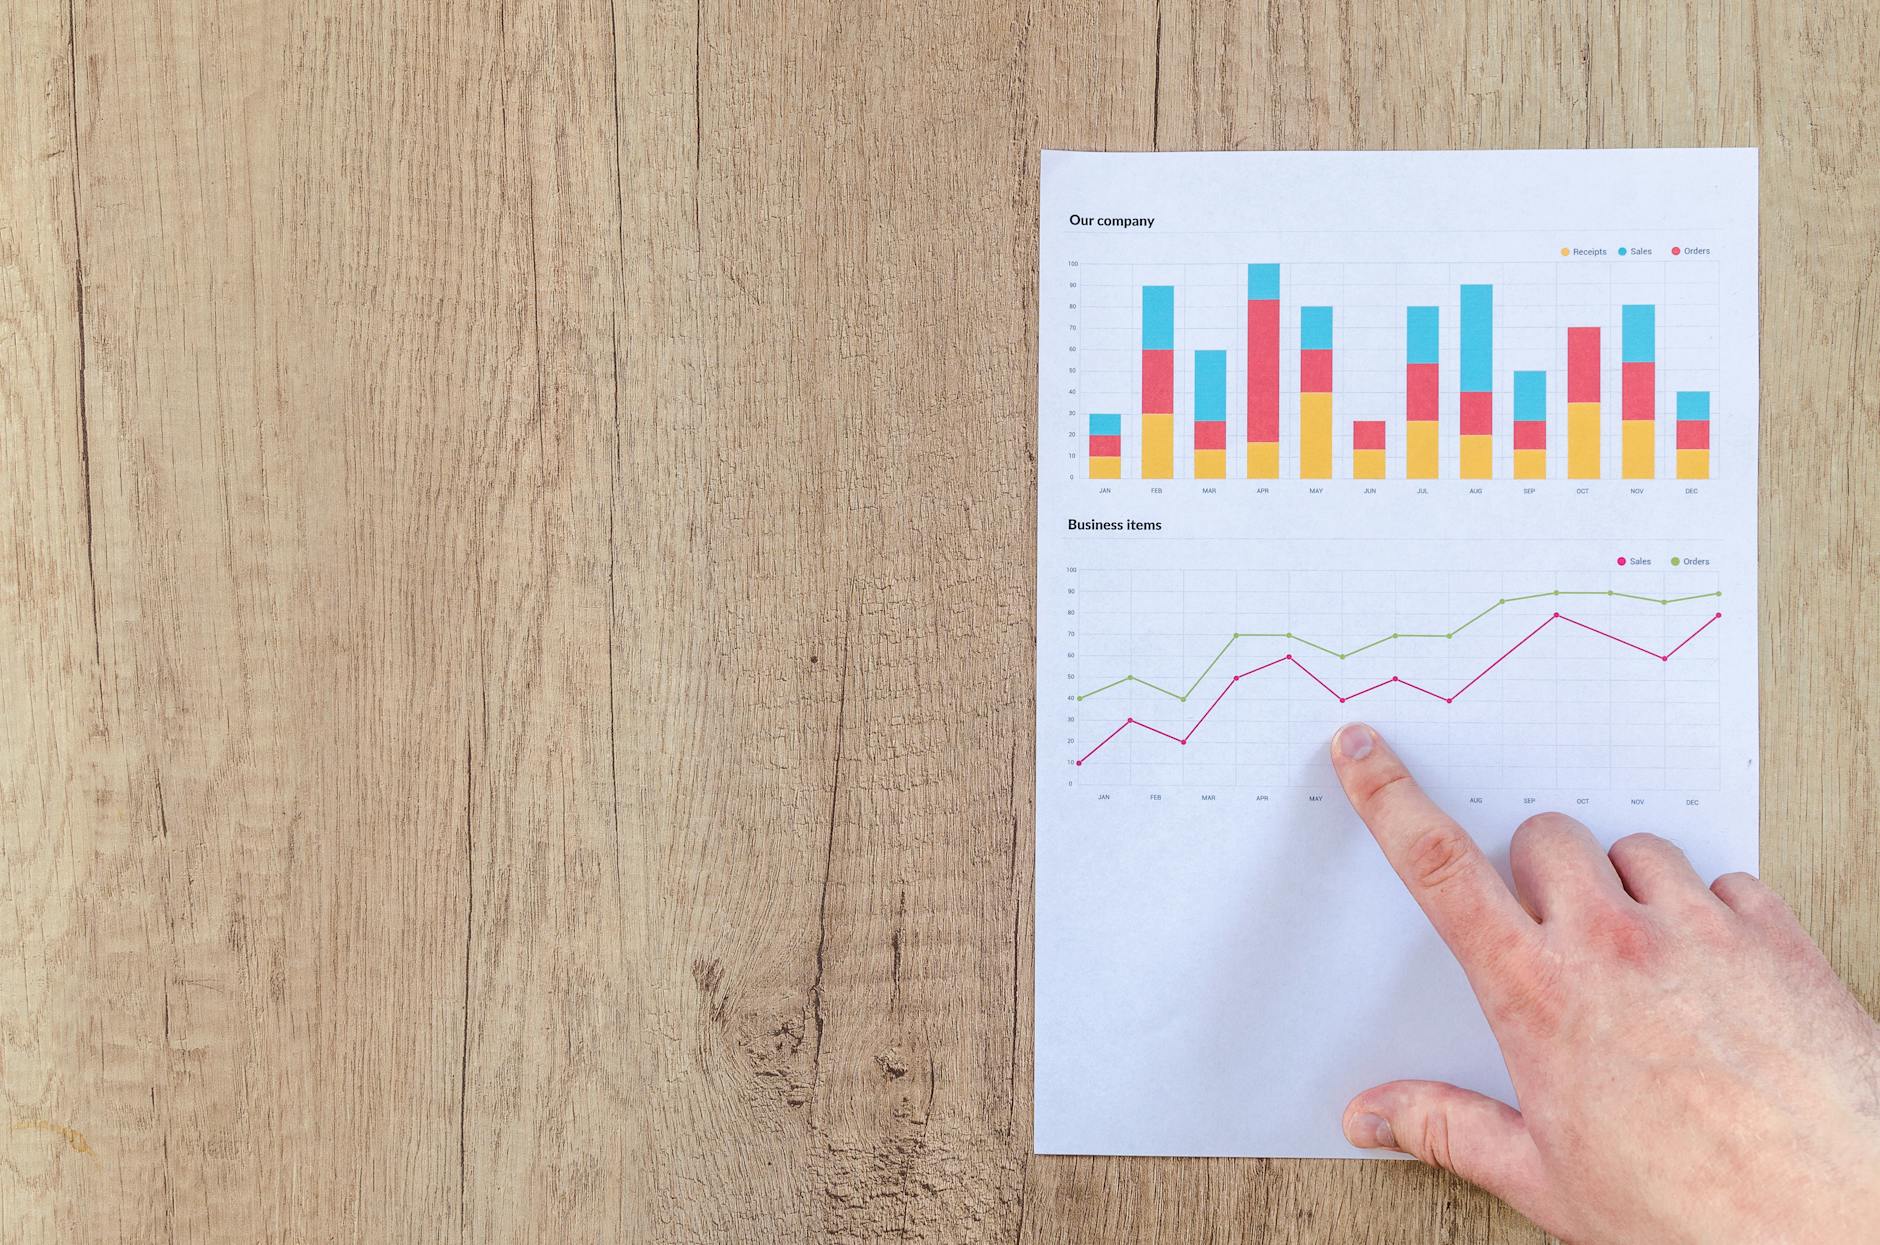
Photo by Lukas
Step 1: Start With the Basics
The top of the fund fact sheet gives you the “name tag” of the fund. Key items to spot:
- Fund name and type: Canadian equity, global bond, balanced, index ETF, and so on. Make sure the type matches your goal. Saving for a down payment in three years is very different from investing for retirement in 25 years.
- Objective: A short line such as “seek long-term capital growth by investing mainly in Canadian stocks.” If the goal does not match what you want, you can move on before reading the rest.
- Fund currency and series: For Canadians, you will often see CAD and a series like A, F, or D. Different series can have different fees.
If the objective and type do not fit your plan, there is no need to dig deeper into that sheet.
Step 2: Scan the Holdings
Next, find the section that shows what the fund actually owns. You will usually see an asset mix chart, such as 60% stocks and 40% bonds, top 10 holdings, with company names and weight, and sometimes, geographic or sector breakdowns. Ask yourself a few simple questions:
- Does this fund already hold a lot of the same banks and telecom stocks that you own elsewhere?
- Is it mostly Canada, or does it hold U.S. and international companies too?
- If it is called a “global” fund, does it really hold many countries, or is it mostly the U.S.?
You want your overall portfolio to be diversified, not just one fund stuffed inside another that holds the same things.
Step 3: Read the Risk and Volatility
Every Canadian fund fact sheet must show a risk rating, usually on a scale from low to high. This is the fund company’s view of how bumpy the ride might be. You may also see the word volatility which means how much the fund’s price tends to jump up and down. Bigger swings, up or down, mean higher volatility.
Sometimes, a sheet will show a Sharpe ratio. That is a number that compares return to volatility. A higher Sharpe ratio means the fund has earned more return for each unit of risk in the past. For short-term money, a fund labeled “Medium to High” risk or showing big year-to-year swings is usually a poor fit. For long-term retirement savings, some volatility is normal, but you still want to sleep at night. The Canadian Securities Administrators have a nice summary of how ETF Facts explain risks if you invest in ETFs.
Step 4: Compare Past Performance
The performance table or chart is where many people get hooked on the highest number. Try not to. You will usually see 1-year, 3-year, 5-year, 10-year, and “since inception” returns. Calendar year returns, show how the fund did each year. There are two simple ideas help here:
- Longer is better than shorter:
A fund that earned 15% over the last 1 year but only 3% per year over 5 years has had a nice recent run, but not a great long-term record. - Compare to the right thing:
If the sheet shows a benchmark, such as the S&P/TSX Composite Index, see how often the fund has beaten it.
Here is an example:
| Period | Fund return (per year) |
|---|---|
| 1-year | 15% |
| 5-year | 4% |
This fund looks great at first glance, but over 5 years it hasn’t been that strong. If another low-fee index fund has earned 6% per year over 5 years, you might prefer the boring winner. The Alberta Securities Commission’s CheckFirst site has a helpful guide on how to read a fund fact sheet for mutual funds and ETFs for more examples of performance charts.
Step 5: Focus on Fees, Not Hype
Fees are the unpopular part of the fact sheet, but they matter a lot. Look for MER (Management Expense Ratio) or TER (Total Expense Ratio): This is the yearly cost of running the fund, shown as a percentage of the money you invest. TER is a broader term that can include more operating costs, but in practice MER and TER both express the ongoing percentage you pay. Example:
- Fund A MER: 0.75%
- Fund B MER: 0.15%
On $10,000, Fund A costs about $75 per year. Fund B costs about $15 per year. That $60 gap seems small, but over 20 or 30 years, the higher fee can quietly eat thousands of dollars of your returns. You may also see:
- Sales charges: Front-end or deferred sales charges are less common now, but if they show up, ask why you’re paying them.
- Trailing commissions: For some mutual funds, part of the MER pays your advisor each year.
ETFs often have lower MERs, but you may pay a trading commission when buying or selling. Always compare funds that try to do the same job, such as two broad Canadian equity index funds.
Step 6: Other Details (Benchmark, Size, Income)
Near the end of the fund fact sheet, you will usually find a few extra details that are easy to skim but worth a quick look. Common items:
- Benchmark: This is the index the fund uses as a yardstick, such as a Canadian bond index. Active funds try to beat their benchmark. Index funds and ETFs try to match it.
- Fund size (assets under management): A very tiny fund can sometimes be at risk of closing, although many small funds are fine.
- Distribution policy: How often the fund pays income (monthly, quarterly, annually) and whether it is interest, dividends, or capital gains. Good to know if you are counting on cash flow.
Some sheets also show risk stats like Sharpe ratio or standard deviation. You do not have to crunch these, just remember that higher Sharpe is usually better for the same type of fund. If you want to see real-world examples, you can browse mutual fund and ETF PDFs on Fidelity Canada’s Fund Facts page.
Simple Checklist for Any Fund Fact Sheet
Here is a quick checklist of things to consider when you’re reading a fund fact sheet.
- Does the fund’s objective and type match my goal and time frame?
- Do the holdings add something new to what I already own?
- Is the risk rating in line with how much loss I could handle in a bad year?
- Do 5-year and 10-year returns look reasonable compared with the benchmark?
- Are fees (MER or TER) low for this type of fund?
- Do the benchmark, size, and distributions make sense for how I plan to use it?
If a fund fails two or three of these checks, it is probably not your best choice.
Final Thoughts: Make the Sheet Work for You
A fund fact sheet’s purpose is there to warn and inform you about the fund in question. Next time your bank or advisor suggests a fund, pull up the fact sheet and walk through the details. Over time, you will build the habit of checking objective, holdings, risk, performance, and fees before saying yes to any investment.
Leave a Reply